


Journal #14: Is the US Economy Still Glass Half Full?
June 2024

Greetings. Last August, in Journal #4, I described the US economy as being glass half full. In this journal, I want to revisit this theme given the recent economic data released by the US government and the mixed signals from Q1 earnings results.
Q1 Earnings Were Great… Well, Mainly for 7 Companies
The headline number for S&P 500 Q1 earnings was impressive: an 8% year-over-year (YoY) growth, surpassing the start-of-quarter estimate of 5%. This 8% growth was the highest YoY growth since 2022. As the chart below shows, most sectors outperformed their expectations from the beginning of the year. However, there is a catch: the "Magnificent 7" (the top 7 stocks of the S&P 500) had an aggregate growth rate of 51.7%. If we exclude these companies, the growth rate for the remaining S&P 493 drops to 1.6% from 8%. In fact, if we just exclude Nvidia alone, the S&P 499 growth rate drops by 2.8%, from 8% to 5.2%.
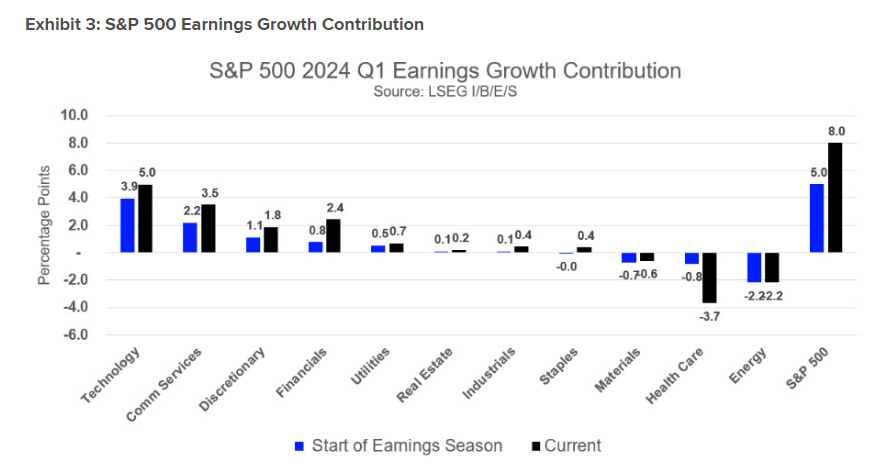
Source: https://lipperalpha.refinitiv.com/2024/06/sp-500-2024-q1-earnings-review-a-good-start-to-the-year/
Perhaps I am being too harsh on the S&P 493; after all, they are at least profitable. However, the situation is more concerning for small-cap companies. According to JPM Asset Management, 42% of small-cap companies are unprofitable (see chart below). Additionally, their interest coverage ratio is below the long-term average. This is occurring while most of Wall Street believes that the Fed has engineered a “soft landing.” But what if this isn't a soft landing?
When we look at corporate America today, the glass seems very full for a select few but much emptier, or even very empty, for the majority.

Source: https://am.jpmorgan.com/us/en/asset-management/adv/insights/market-insights/guide-to-the-markets/
Same Situation for the Consumers?
Last August, here is what I wrote about the US economy:
“Despite the Federal Reserve executing the most significant interest rate hike in the past 40 years, the reason why the US economy remained strong, in my view, was primarily due to the surplus savings from COVID stimulus. At its peak, these excess savings from Biden's stimulus checks amounted to $2.5 trillion, roughly 10% of the US GDP. These excess savings have been the growth engine for the US economy over the past two years, as roughly 70% of the US GDP is based on consumption.”
Unfortunately, according to the Federal Reserve Bank of San Francisco last month, these “pandemic savings are gone” (see chart below).

Data from JP Morgan Chase, the largest bank in the US, using its own customer bank accounts, also points to the same conclusion.

The end of excess savings doesn’t mean the end of the world, but it does have two implications:
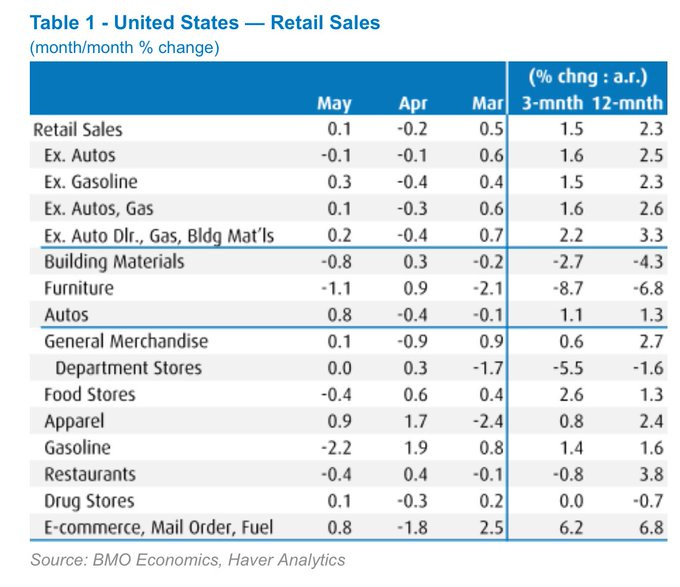
1) Consumer spending cutbacks have started and will continue. Recent retail sales data shows a downshift, with the 3-month average growth notably below the 12-month growth, signaling a reduction in spending.
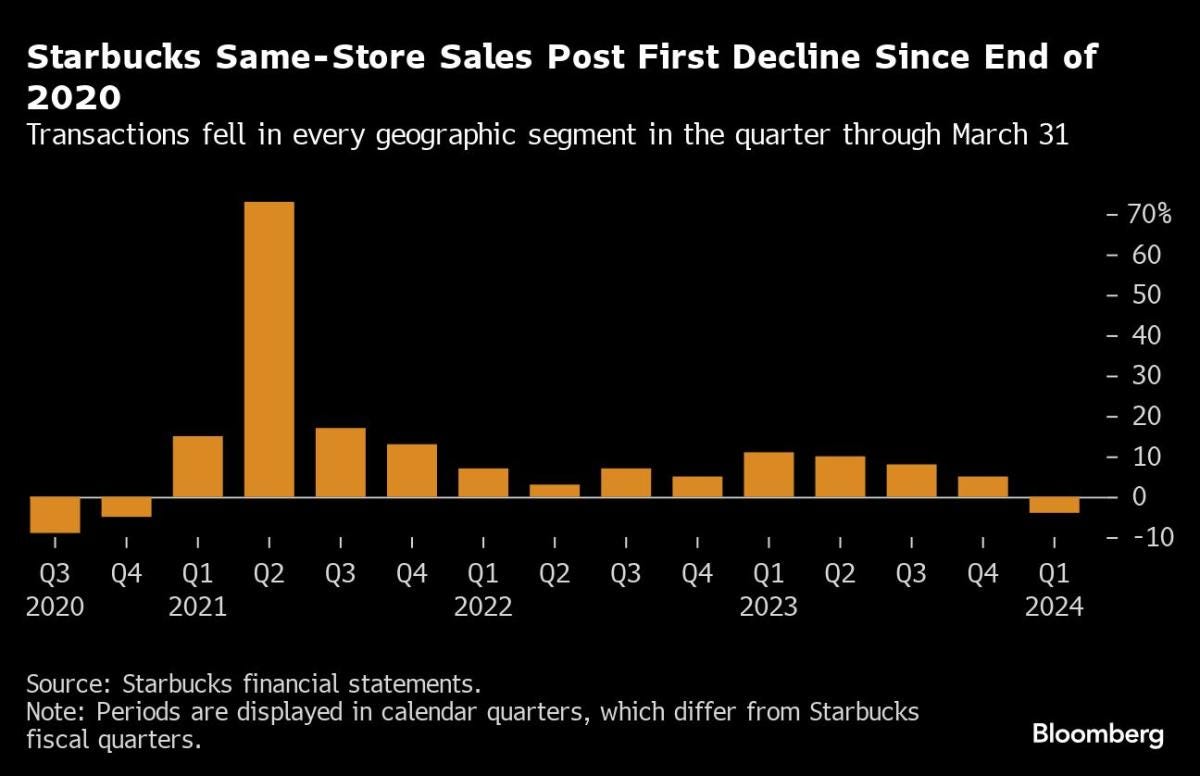
What’s another sign that consumers are cutting back? Consider the $7 Frappuccino—an indulgence that’s enjoyable but not necessary. Since becoming a public company in the 1990s, Starbucks has only experienced negative same-store sales during recessions. In its latest earnings release, Starbucks reported negative same-store sales for Q1, causing its stock to drop 20% in one day. It seems even our love for overpriced coffee has a limit!
2) Credit card delinquency will continue its recent rise, especially if labor conditions deteriorate further. The recent increase in credit card delinquency for both the poorest 10% and the richest 10% of zip codes mirrors the trends seen during the 2001/02 and 2008/09 recessions.

No wonder "vibecession" has been trending up on social media these days, even though the official stats are all about economic resilience. Looks like the bottom 50% of consumers are feeling more like their glass is half full of air than water compared to last year.
Job Data is Sending Mixed Signals
Ultimately, the job market holds the key to understanding the US economy for the next 6 to 12 months. Unfortunately, the job data is currently sending mixed signals. Typically, the US government collects job data from two main sources: employer surveys and employee surveys.
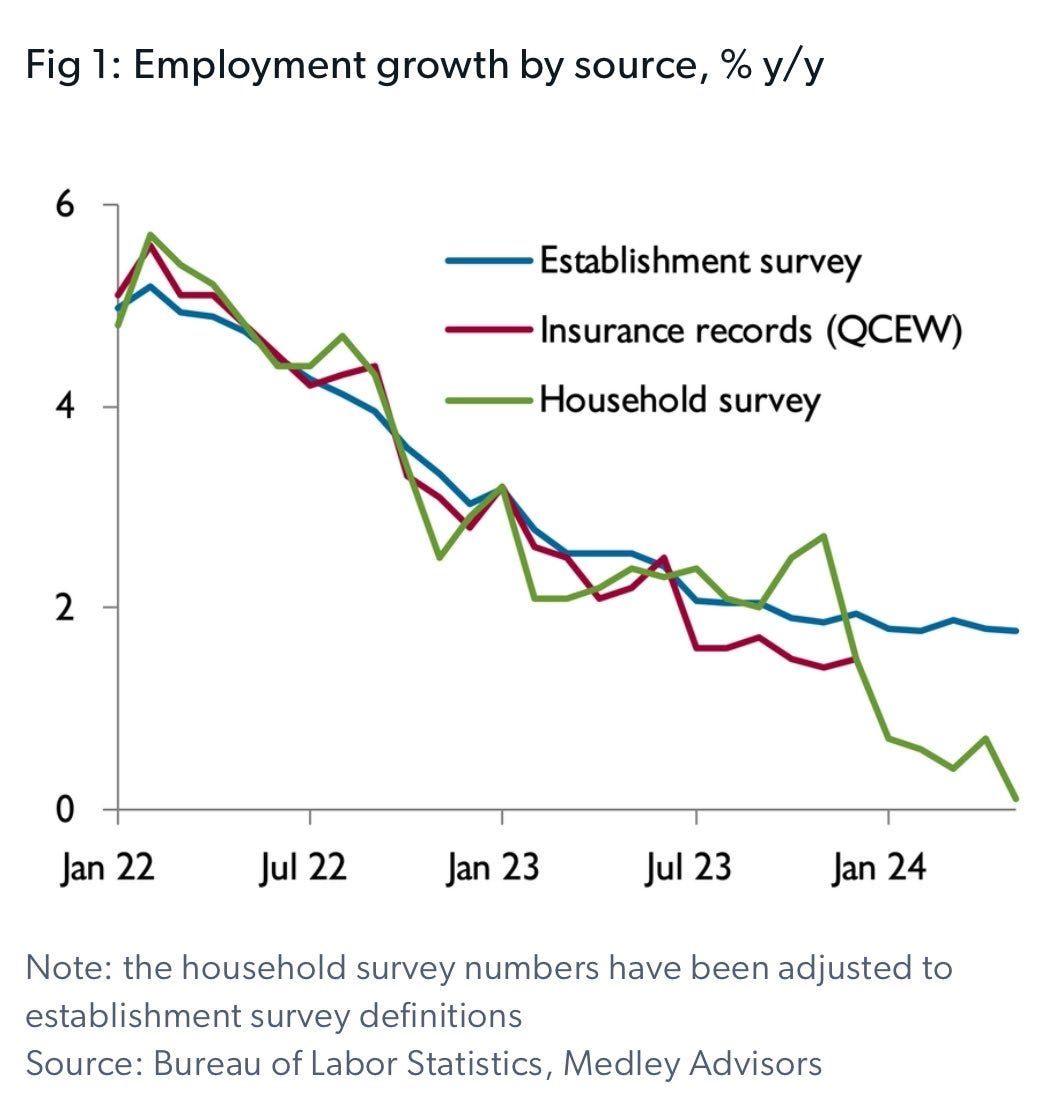
Employer surveys, known as establishment surveys, and household surveys from employees generally and historically paint a similar picture of the US job market. However, in recent months, they have diverged. The establishment survey continues to show decent job growth, whereas the household survey now indicates no growth in the job market, as illustrated below.
Ultimately, the unemployment rate, based on the household survey, will play a crucial role in shaping Federal Reserve decisions and framing the economic narrative. Unfortunately, here's the harsh reality: the latest unemployment rate has just exceeded its 36-month moving average (see below). Historically, once this threshold is breached, the unemployment rate tends to keep climbing.
The silver lining is that the Federal Reserve will then respond by cutting rates, but the narrative won't be of a soft landing. As always, thanks for reading.
